Influenza Update N° 426
Overview
22 August 2022, based on data up to 7 August 2022
Information in this report is categorized by influenza transmission zones, which are geographical groups of countries, areas or territories with similar influenza transmission patterns. For more information on influenza transmission zones, see the link below:
Influenza Transmission Zones (pdf, 659kb)
- The current influenza surveillance data should be interpreted with caution as the ongoing COVID-19 pandemic has influenced to varying extents health seeking behaviours, staffing/routines in sentinel sites, as well as testing priorities and capacities in Member States. Various hygiene and physical distancing measures implemented by Member States to reduce SARS-CoV-2 virus transmission have likely played a role in reducing influenza virus transmission.
- Countries are recommended to monitor the co-circulation of influenza and SARS-CoV-2 viruses. They are encouraged to enhance integrated surveillance and step-up their influenza vaccination campaign to prevent severe disease and hospitalizations associated with influenza. Clinicians should consider influenza in differential diagnosis, especially for high-risk groups for influenza, and test and treat according to national guidance.
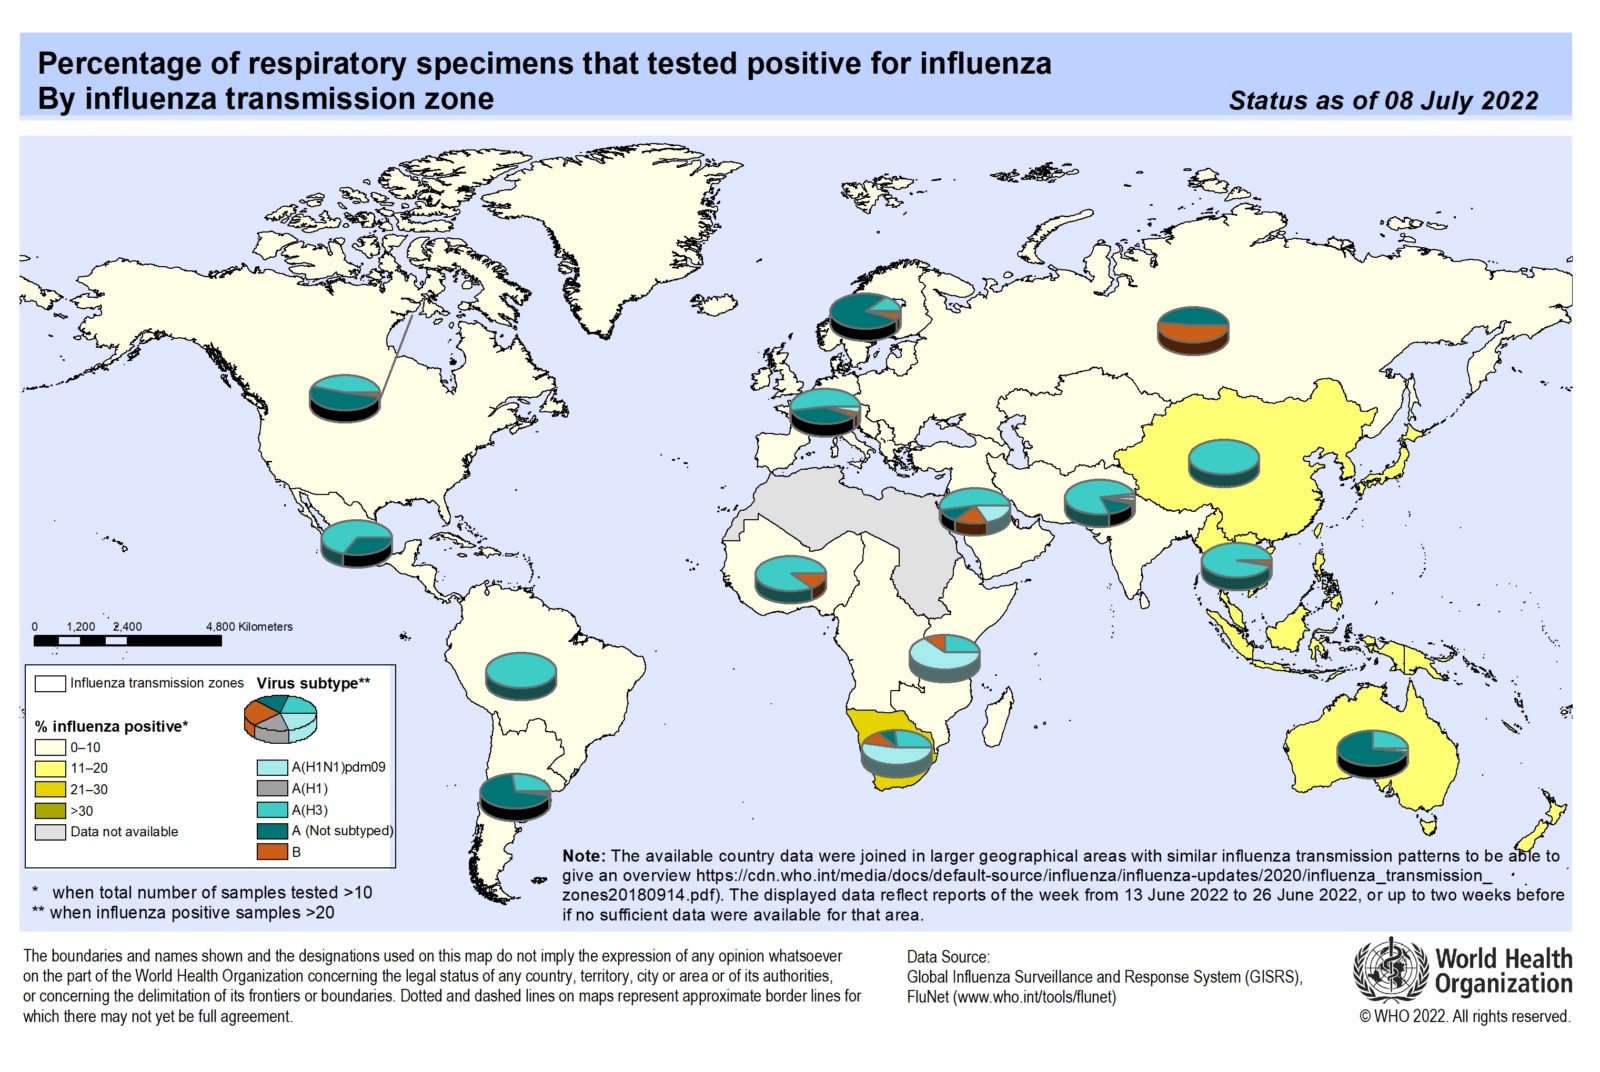
- Global influenza activity has steadily decreased from a peak in March 2022, except in South-east Asia where influenza activity increased.
- In the temperate zones of the southern hemisphere, overall influenza activity appeared to further decrease this reporting period.
- In Oceania, detections of primarily influenza A(H3N2) decreased overall and influenza-like activity (ILI) activity returned to low levels in most Pacific Island countries.
- In Southern Africa, influenza activity decreased overall with continued detections of influenza A(H1N1)pdm09 and influenza A(H3N2) and a few influenza B viruses.
- In temperate South America, influenza activity decreased overall. Influenza A(H3N2) viruses predominated among subtyped detections.
- In the Caribbean and Central American countries, low influenza activity was reported with influenza A(H3N2) most frequently detected.
- In the tropical countries of South America, influenza detections were low and A(H3N2) detections predominated.
- In tropical Africa, influenza activity continued to decrease with influenza A(H3N2) viruses predominant among the reported detections.
- In Southern Asia, influenza detections of predominantly A(H3N2) viruses decreased while detections of influenza A(H1N1)pdm09 increased in recent weeks, especially in India.
- In South-East Asia, influenza activity increased overall with influenza A(H3N2) viruses predominantly detected.
- In the countries of North America, influenza activity remained at inter-seasonal levels as typically observed at this time of year. Influenza A(H3N2) was predominant among the subtyped viruses.
- In Europe, overall influenza activity remained at inter-seasonal levels with influenza A(H3N2) predominant among the subtyped viruses.
- In Central Asia, no influenza detections were reported.
- In Northern Africa, no influenza detections were reported.
- In East Asia, influenza activity of predominantly influenza A(H3N2) seemed to have peaked in the southern provinces of China. Elsewhere, influenza illness indicators and activity remained low.
- In Western Asia, low numbers of detections of influenza A(H1N1)pdm09, A(H3N2) and B viruses were reported.
- National Influenza Centres (NICs) and other national influenza laboratories from 101 countries, areas or territories reported data to FluNet for the time period from 25 July 2022 to 07 August 2022* (data as of 2022-08-22 13:05:53 UTC). The WHO GISRS laboratories tested more than 263 527 specimens during that time period. 6193 were positive for influenza viruses, of which 5960 (96.2%) were typed as influenza A and 233 (3.8%) as influenza B. Of the sub-typed influenza A viruses, 292 (6.2%) were influenza A(H1N1)pdm09 and 4423 (93.8%) were influenza A(H3N2). Of the characterized B viruses, 48 (100%) belonged to the B-Victoria lineage.
 During the COVID-19 pandemic, WHO encourages countries, especially those that have received the multiplex influenza and SARS-CoV-2 reagent kits from GISRS, to conduct integrated surveillance of influenza and SARS-CoV-2 and report epidemiological and laboratory information in a timely manner to established regional and global platforms. Revised interim guidance has just been published here: https://covid.comesa.int/publications/i/item/WHO-2019-nCoV-integrated_sentinel_surveillance-2022.1.
- COVID-19 positivity from sentinel surveillance continued to decrease and was at approximately 40% in the reporting period. The highest positivity rate was reported in the region of the Americas while in the other regions remained below 20%. Activity from non-sentinel sites remained stable overall, with overall positivity around 40%.
- National Influenza Centres (NICs) and other national influenza laboratories from 55 countries, areas or territories from six WHO regions (African Region: 9; Region of the Americas: 16; Eastern Mediterranean Region: 4; European Region: 19; South-East Asia Region: 4; Western Pacific Region: 3) reported to FluNet from sentinel surveillance sites for time period from 25 Jul 2022 to 07 Aug 2022* (data as of 2022-08-22 13:05:53 UTC). The WHO GISRS laboratories tested more than 71 551 sentinel specimens during that time period and 31 026 (43.4%) were positive for SARS-CoV-2. Additionally, more than 780633 non-sentinel or undefined reporting source samples were tested in the same period and 316005 were positive for SARS-CoV-2. Further details are included at the end of this update.
Source of data
______________________________________________________________________________________________
The Global Influenza Programme monitors influenza activity worldwide and publishes an update every two weeks. The updates are based on available epidemiological and virological data sources, including FluNet (reported by the WHO Global Influenza Surveillance and Response System), FluID (epidemiological data reported by national focal points) and influenza reports from WHO Regional Offices and Member States. Completeness can vary among updates due to availability and quality of data available at the time when the update is developed.
*It includes data only from countries reporting on positive and negative influenza specimens.