Influenza Update N° 436
Overview
09 January 2023, based on data up to 25 December 2022
Information in this report is categorized by influenza transmission zones, which are geographical groups of countries, areas or territories with similar influenza transmission patterns. For more information on influenza transmission zones, see the link below:
Influenza Transmission Zones (pdf, 659kb)
- Countries are recommended to monitor the relative co-circulation of influenza and SARS-CoV-2 viruses and report to FluNet and FLUID directly or via regional platforms. They are encouraged to enhance integrated surveillance , and in northern hemisphere countries step-up their influenza vaccination campaign to prevent severe disease and hospitalizations associated with influenza. Clinicians should consider influenza in differential diagnosis, especially for high-risk groups for influenza, and test and treat according to national guidance. Because of changes in surveillance of respiratory viruses during the COVID-19 pandemic, comparisons of current data with that from previous seasons should be interpreted with caution. Under-reporting due to the end of the year holidays may affect the data and conclusions below.
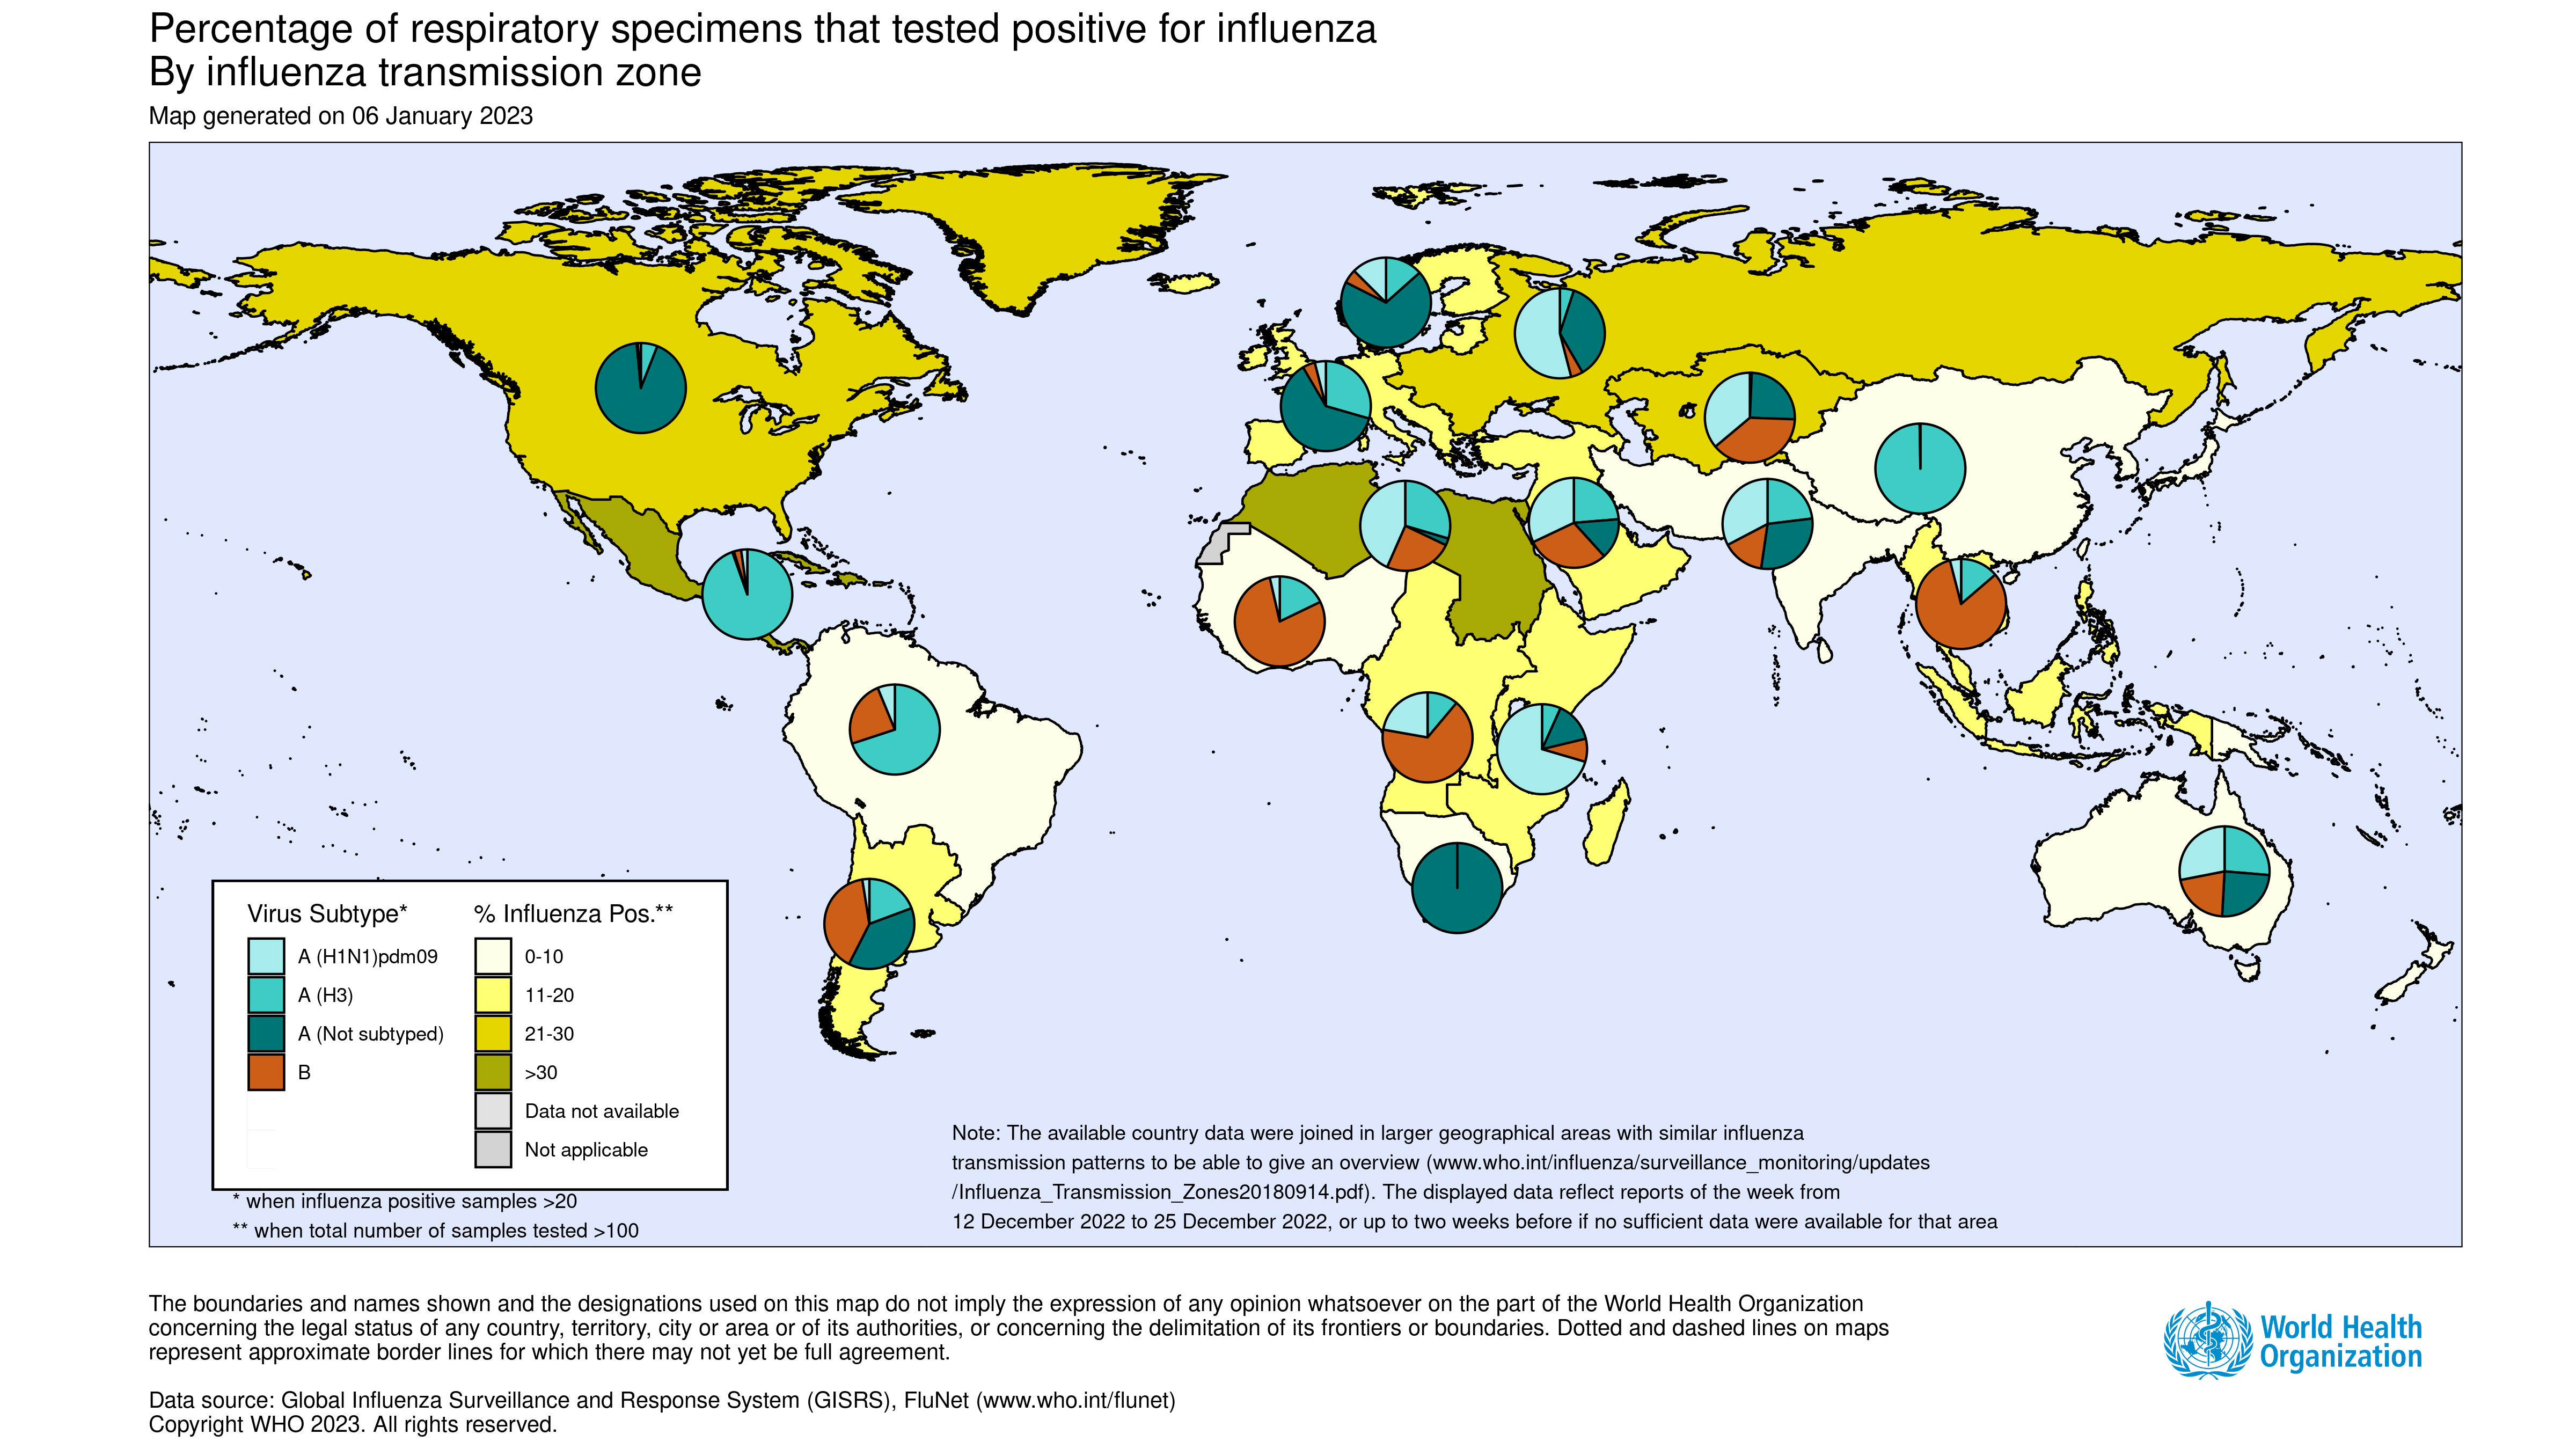
- Globally, influenza activity remained elevated due to activity in the northern hemisphere. Where subtyped, influenza A viruses predominated with a slightly larger proportion of A(H3N2) viruses detected among the subtyped influenza A viruses.
- In the countries of North America, most indicators of influenza activity decreased while others were stable or continued to increase. Many indicators were at, or above, levels typically observed at this time of year, and some were near or above levels observed at the peak of previous severe epidemics. Influenza A(H3N2) was the predominant virus detected.
- In Europe, overall influenza activity continued to increase with influenza positivity from sentinel sites remaining above the epidemic threshold at the regional level. Overall, influenza A viruses predominated with A(H3N2) viruses accounting for the majority of subtyped influenza viruses from primary care sentinel sites but with regional differences. Half of reporting countries signalled high or very high intensity. In central Asia, influenza activity increased with influenza A(H1N1)pdm09 viruses predominant followed by influenza B viruses.
- In Northern Africa, influenza detections increased among reporting countries with all seasonal subtypes detected.
- In Western Asia, influenza activity decreased overall with all seasonal influenza subtypes detected, though increased activity was reported in some countries.
- In East Asia, influenza activity of predominantly influenza A(H3N2) viruses remained low overall among reporting countries but with increases reported in Mongolia and the Republic of Korea.
- In the Caribbean and Central American countries, influenza activity of predominantly influenza A(H3N2) viruses decreased overall but remained elevated in Mexico.
- In the tropical countries of South America, influenza detections were generally low, and A(H3N2) viruses predominated. Influenza positivity was at a moderate level in Ecuador.
- In tropical Africa, influenza activity remained low with detections of all seasonal influenza subtypes reported. Activity increased in some countries in Eastern Africa.
- In Southern Asia, influenza activity remained at a low level, mainly due to decreased activity reported in Iran (Islamic Republic of). Influenza A(H1N1)pdm09 was the most frequently detected subtype in the subregion.
- In South-East Asia, detections of predominantly influenza B remained elevated due to continued detections reported in Malaysia.
- In the temperate zones of the southern hemisphere, influenza activity decreased in Argentina and Chile to low levels and remained low elsewhere.
- National Influenza Centres (NICs) and other national influenza laboratories from 131 countries, areas or territories reported data to FluNet for the time period from 12 December 2022 to 25 December 2022* (data as of 2023-01-06 02:10:00 UTC). The WHO GISRS laboratories tested more than 604 408 specimens during that time period. 121 935 were positive for influenza viruses, of which 117 840 (96.6%) were typed as influenza A and 4095 (3.4%) as influenza B. Of the subtyped influenza A viruses, 10 108 (43.5%) were influenza A(H1N1)pdm09 and 13 123 (56.5%) were influenza A(H3N2). Of the type B viruses for which lineage was determined, all 525 (100%) belonged to the B/Victoria lineage.
- SARS-CoV-2 positivity from sentinel surveillance continued to increase in the WHO Regions of the Americas and Western Pacific. Activity increased to just over 30% in the Region of the Americas and to 15% in the Western Pacific Region and increased slightly in the WHO European Region to 10%. Activity decreased and remained under 10% in the other regions. Globally, SARS-CoV-2 positivity from non-sentinel surveillance was around 10% or below except in the Regions of the Americas and the Western Pacific where activity maintained an increasing trend above 25%.
- During the COVID-19 pandemic, WHO encourages countries, especially those that have received the multiplex influenza and SARS-CoV-2 reagent kits from GISRS, to conduct integrated surveillance of influenza and SARS-CoV-2 and report epidemiological and laboratory information in a timely manner to established regional and global platforms. The guidance can be found here: https://covid.comesa.int/publications/i/item/WHO-2019-nCoV-integrated_sentinel_surveillance-2022.1.
- National Influenza Centres (NICs) and other national influenza laboratories from 74 countries, areas or territories from six WHO regions (African Region: 13; Region of the Americas: 18; Eastern Mediterranean Region: 5; European Region: 32; South-East Asia Region: 3; Western Pacific Region: 3) reported to FluNet from sentinel surveillance sites for time period from 12 December 2022 to 25 December 2022* (data as of 2023-01-06 02:09:58 UTC). The WHO GISRS laboratories tested more than 58 032 sentinel specimens during that time period and 13 041 (22.5%) were positive for SARS-CoV-2. Additionally, more than 389 472 non-sentinel or undefined reporting source samples were tested in the same period and 152 890 were positive for SARS-CoV-2.
Source of data
______________________________________________________________________________________________
The Global Influenza Programme monitors influenza activity worldwide and publishes an update every two weeks. The updates are based on available epidemiological and virological data sources, including FluNet (reported by the WHO Global Influenza Surveillance and Response System), FluID (epidemiological data reported by national focal points) and influenza and other respiratory virus reports from WHO Regional Offices and Member States. During the COVID-19 pandemic, FluNet has also been receiving updates on testing of samples obtained from routine influenza surveillance systems for SARS-CoV-2. Completeness can vary among updates due to availability and quality of data available at the time when the update is developed.
*It includes data only from countries reporting on positive and negative influenza specimens.